Screen Shots
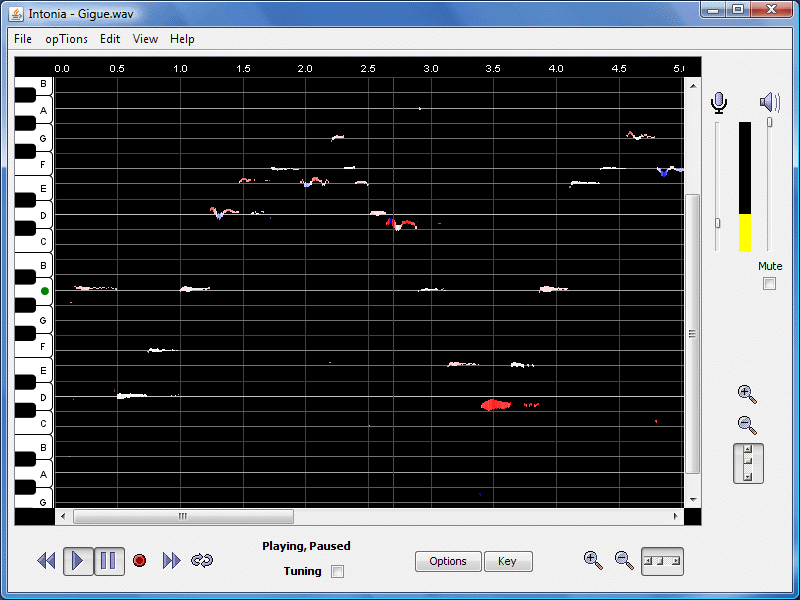
The following screen shots are from the opening bars of the Gigue from the Bach Partita in D minor, as played by Itzhak Perlman (EMI Classics).
Composite View

The Composite View shows pitch, loudness, and intonation as a function of time. The most striking feature of this trace is the sharpness of the leading tones. The C-sharps are bright red, indicating an artistic choice on Perlman's part to play these notes very high. You can also see vibrato on many of the notes.
Amplitude View

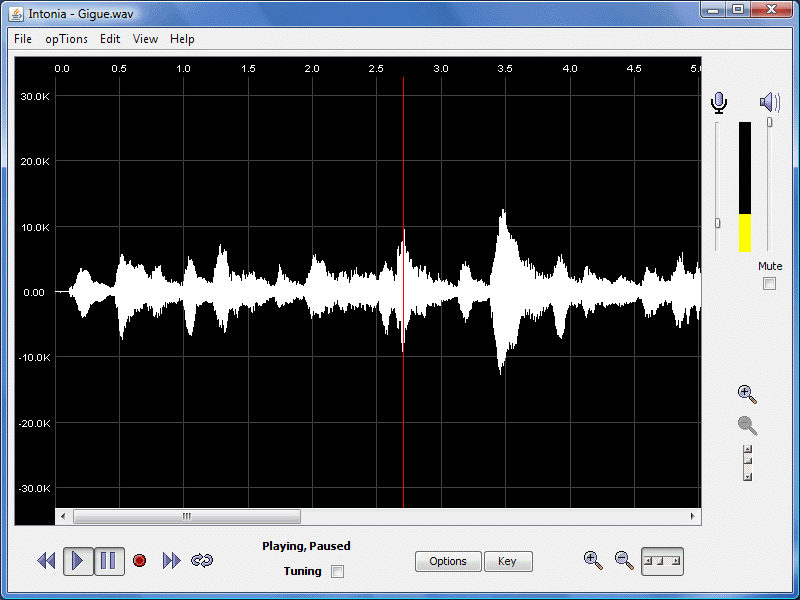
The Amplitude View shows loudness as a function of time. It is similar to the waveform display in many sound recording and processing programs such as Audacity. Intonia does not show the left and right channels separately.
Spectrum View

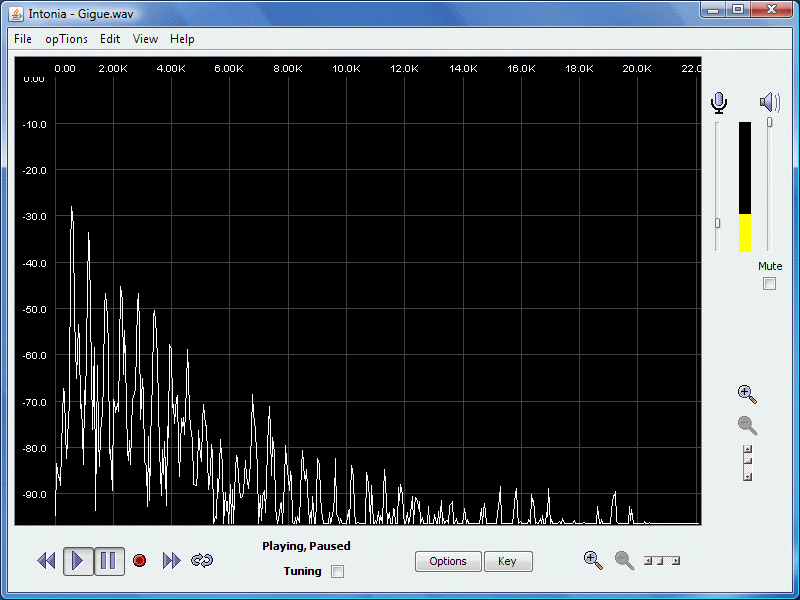
Spectrum View shows the frequency spectrum (FFT) of the signal measured over a short interval of time. The trace above was measured at the position of the "needle", the bright red vertical line in the two screenshots above. Intonia uses the regularly spaced peaks in the spectrum to infer pitch.
Setting Options

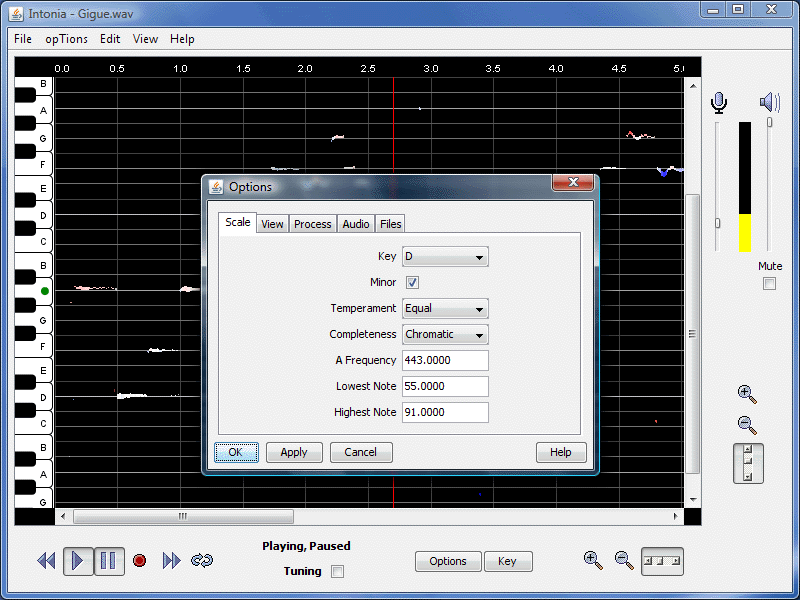
Intonia offers a large number of user-settable options. Itzhak Perlman had his violin tuned sharp when he made this recording, so the analysis was made using a reference of A = 443 Hz. Choosing a key of D minor makes the display emphasize the more important notes in that key in the horizontal lines of the display. The music is analyzed based on equal temperament. If we had chosen Pythagorean temperament, the leading tones would still show up sharp, but not to the same degree.